
Hi everyone, welcome to a new era for this newsletter. I hope that you’ll stick around to receive news about the Open Visualization Academy; we’re aiming to launch the first batch of free and open source master classes and tutorials in the last quarter of 2025. Spread the word!
(I write “we” because I’m gathering a great group of collaborators, all experts in information design and data graphics; I can’t disclose who they are yet because we’re still working on some details, but I’ll do so soon. I’m also working with my former student Michela Effendie and a few University of Miami colleagues, such as Vinicius Sueiro, who designed the Academy logo.)
This is what we’re planning:
First, a core introductory course, which I’ll teach. In around four or five hours, I’ll cover the basics of information design and data graphics.
Besides my basics course, you’ll be able to access in-depth master classes, which will vary in duration from a couple of hours to more than five. Here they are (these aren’t final titles):
Visual and information design
Applied ethics
Reading data graphics
Critical visualization
History of visualization
Building narratives with data and charts
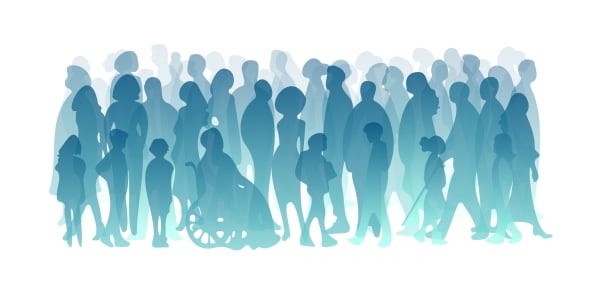
Accessibility
Generative AI for data design
We’ll also have a few courses that will teach concepts and software:
R for data preparation, exploration, and design
Cartography and map design with QGIS
Dashboard design
And several software tutorials:
Adobe Illustrator for information design
FIGMA for prototyping
RawGraphs
Flourish
Datawrapper
Finally, we’re also planning for a series of short videos featuring famous designers explaining the creation process of one of their projects in detail.
This is just the beginning; there’ll be more stuff coming in 2026 and beyond.
The Open Visualization Academy will also host a few in-person conferences. In June we’ll have Outlier, the conference of the Data Visualization Society, VizUM 2025 in November (read our chronicle of the 2024 edition,) and in December we’ll have the Computation + Journalism Symposium. I’ll tell you more about them soon.
We’ll keep you posted through this newsletter, so stay tuned.
Other news
Texty needs our help. If you’ve read any of my books, you know that I’m a big fan of Texty.org.ua, the Ukrainian data and investigative journalism nonprofit. They are asking for some support from their readers. You can send a contribution here; I just did.
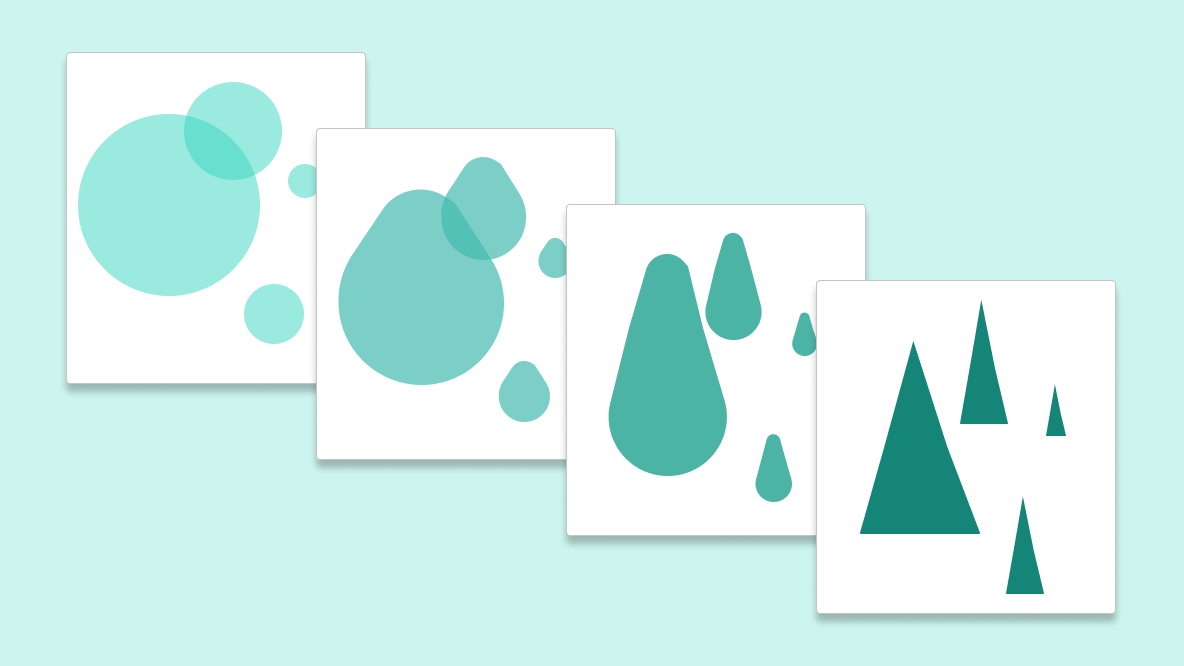
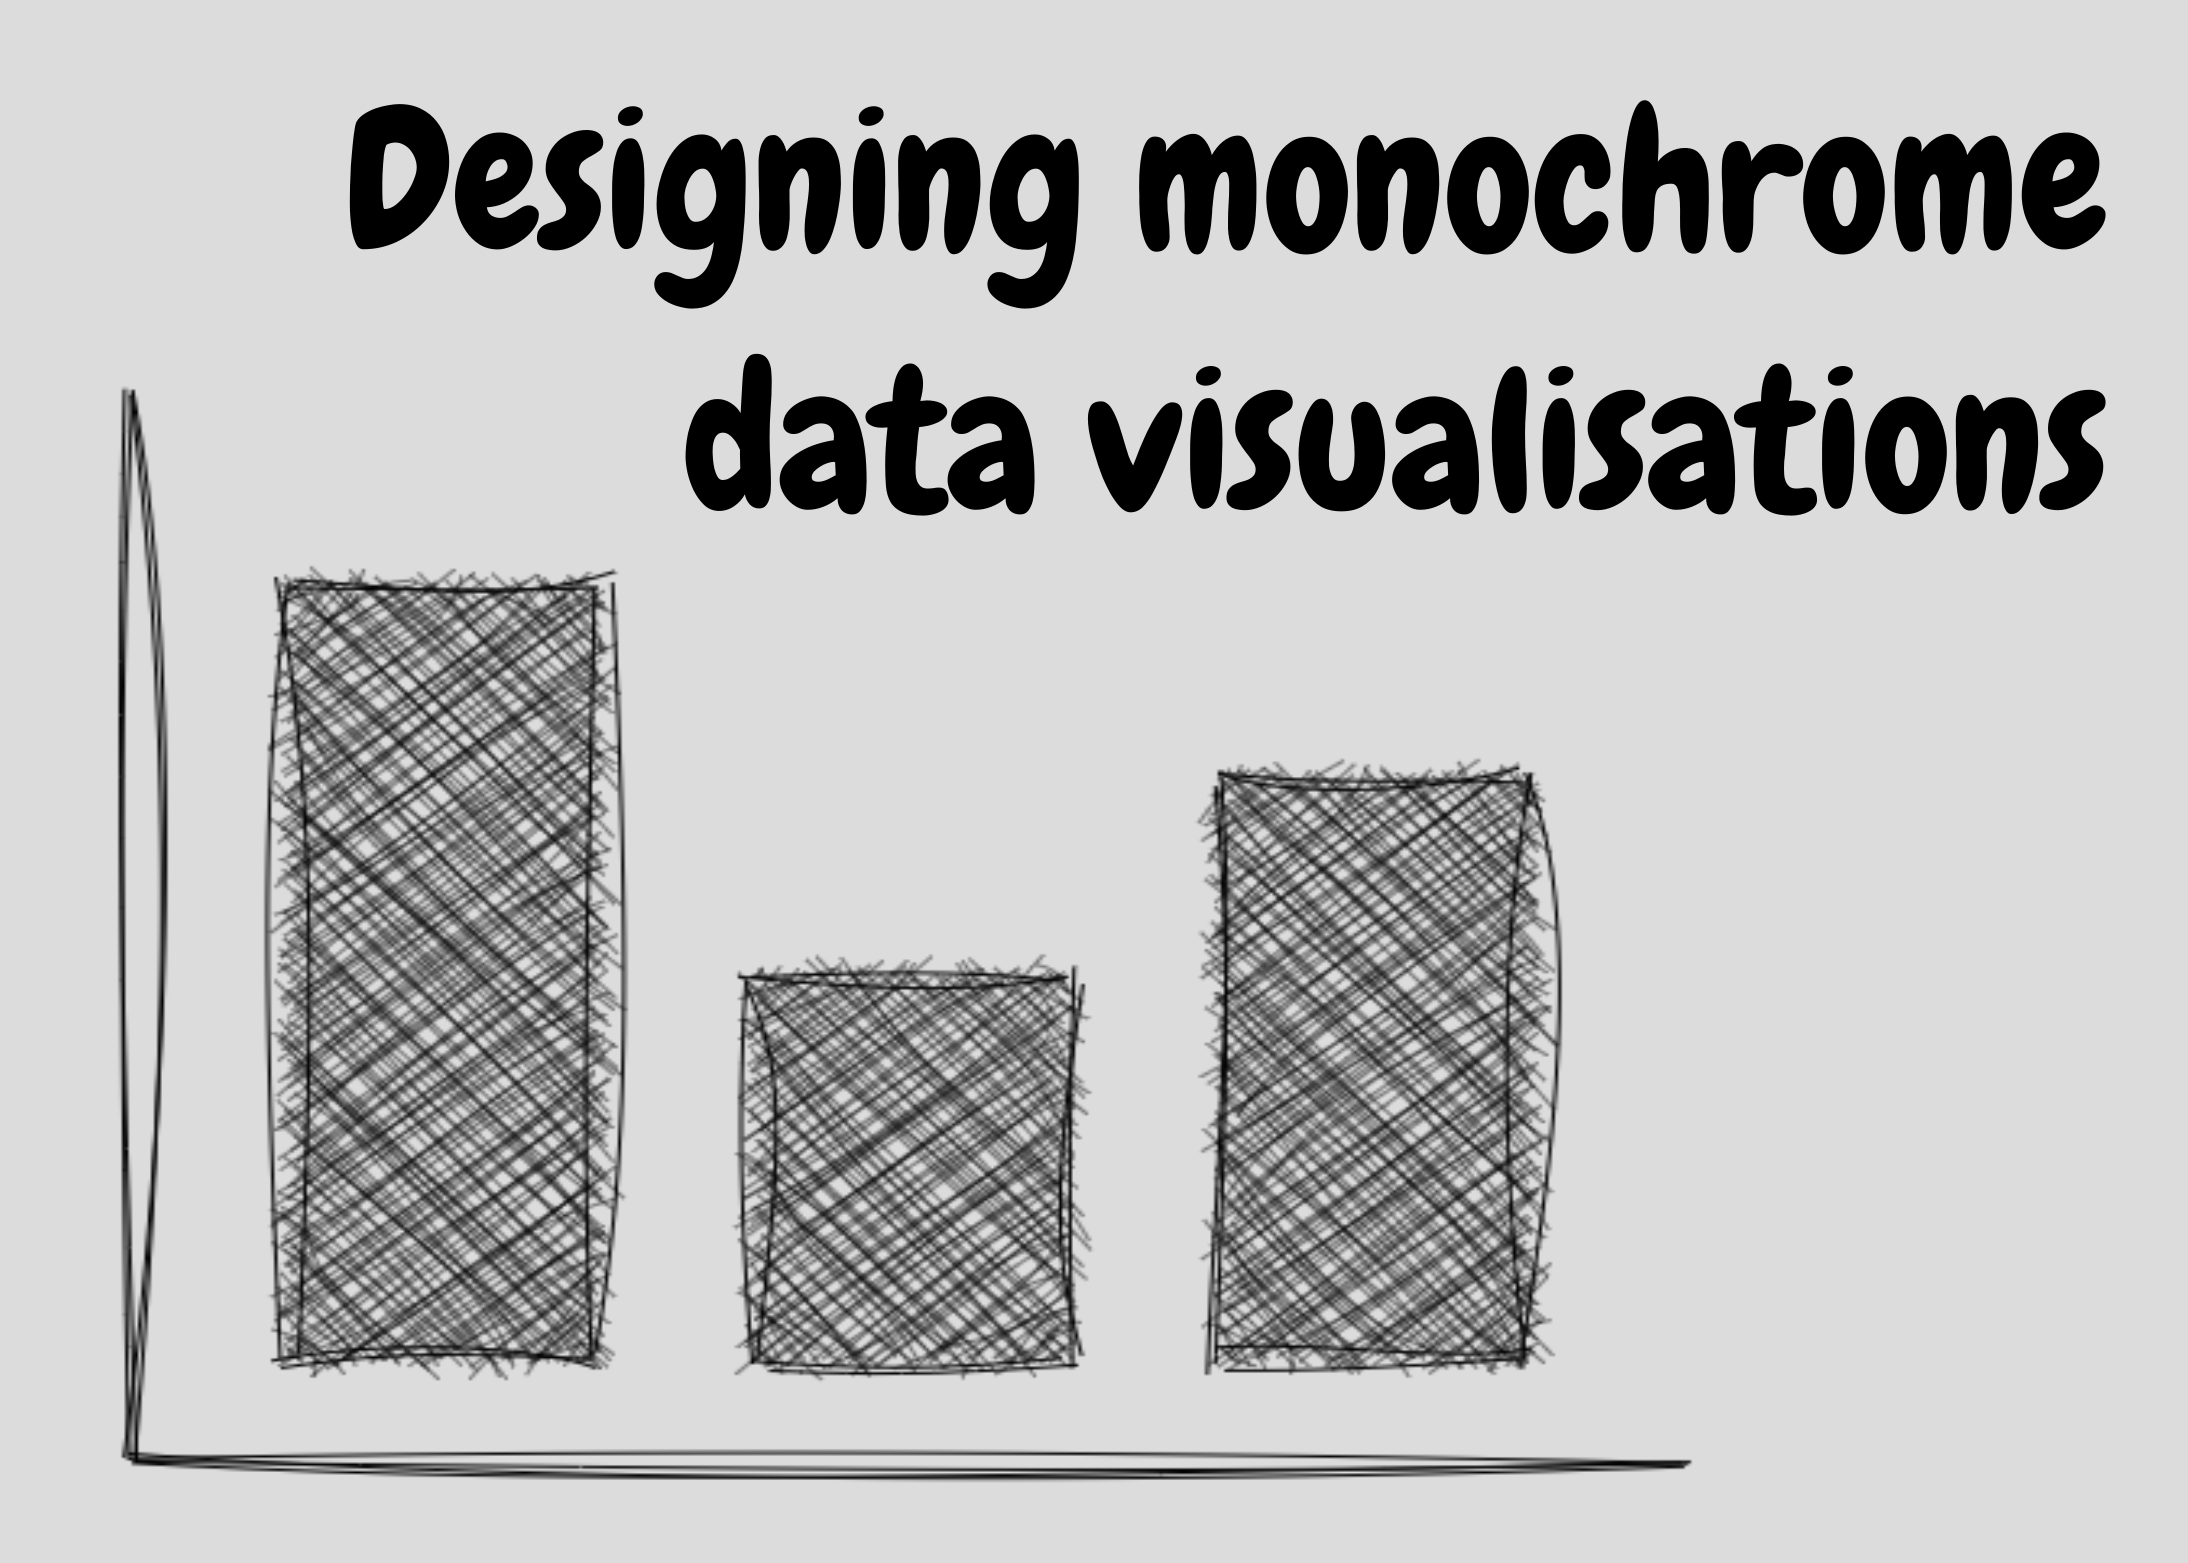
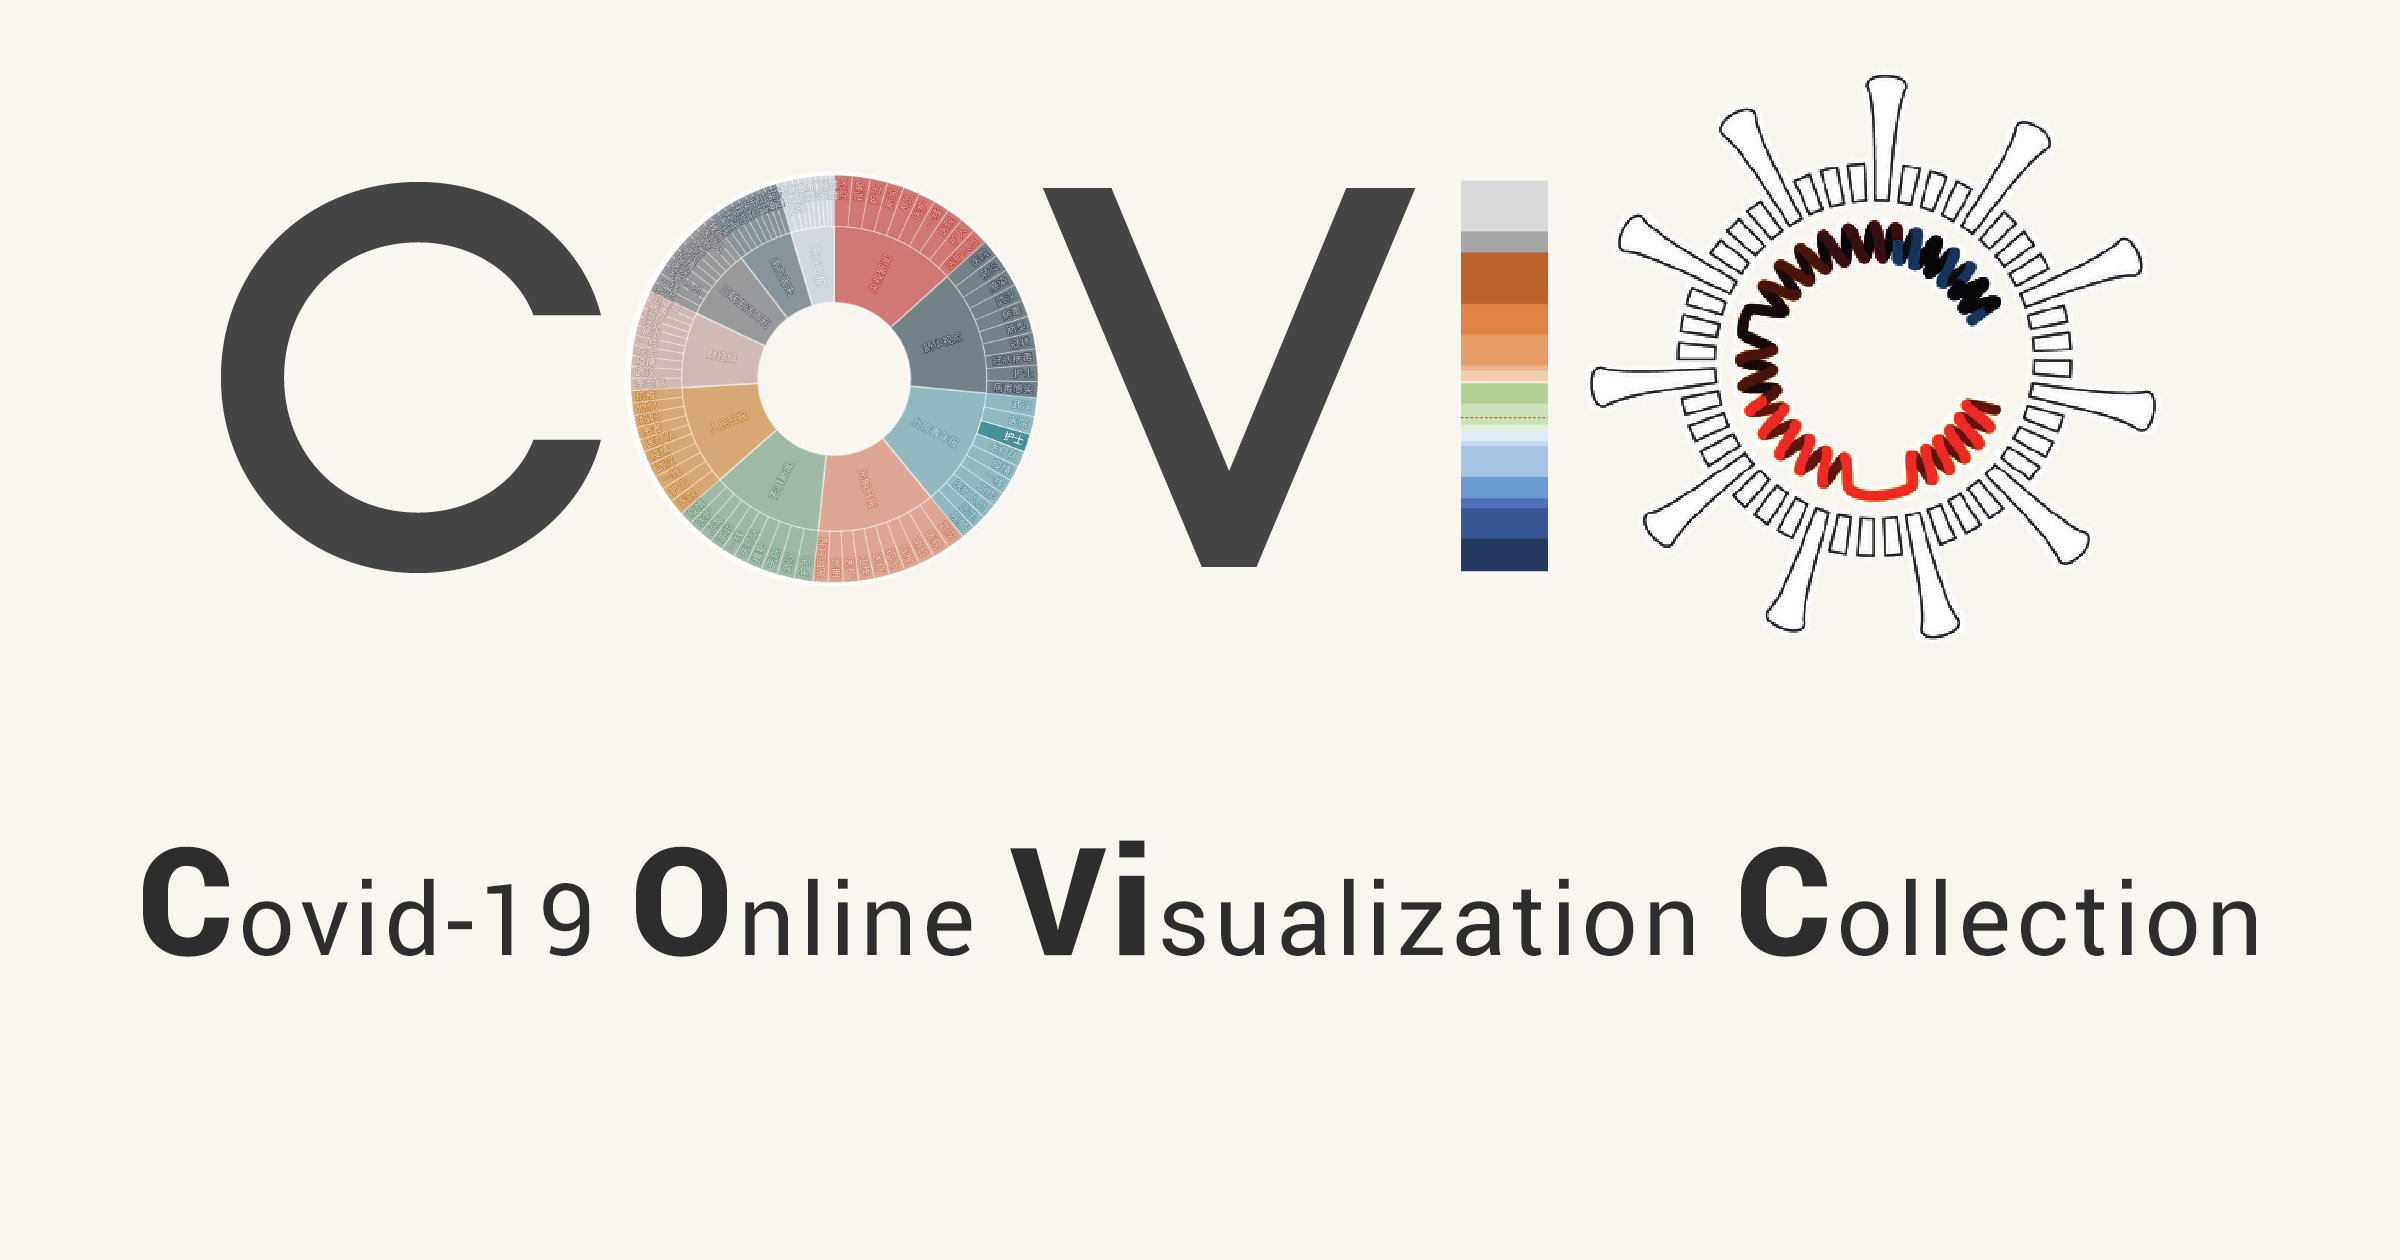
The links below will take you to several articles that got my attention recently on Bluesky. There’s some great insights about animation in visualization, thoughts about making data analysis more equitable, monochrome visualizations, and graphics about the Covid-19 pandemic:
—
That’s all for now. I leave you with Feeling Good, performed by Nina Simone; Butterflies all havin' fun, you know what I mean:
