

Cover of Cristina Rivera Garza’s Liliana’s Invincible Summer (English and Spanish editions) and a screenshot of The Pudding’s Abortion Mazes visual essay
To learn more about the Open Visualization Academy, visit https://openvisualizationacademy.org
Dear friends,
Let’s begin with a few updates.
First, we’re making quick progress with the Open Visualization Academy. Most instructors are already confirmed, so I’m hoping to share the list of free and open source master classes and software tutorials in the next month or two.
The tentative release date of the first batch of materials is November this year. I’m also planning for a new massive open online course (MOOC).
Second, I’m hosting Outlier, the Data Visualization Society conference, in Miami on June 11th-13th. You can register to attend already, and if you have something interesting to share, you can also apply to be a speaker. I hope I’ll see you down here a few months from today.
Third, on December 11th-12th I’m chairing and hosting the Computation + Journalism (C+J) 2025 Symposium; if you want to read more about this gathering, see the website of last year’s edition. I’ll release more information on how to apply to speak at C+J 2025 by May, but you can mark your calendars, as the dates and venue are confirmed and Miami is lovely during the winter.
The theme this year’s C+J is going to be data journalism under autocracy.
∗ ∗ ∗
Now please bear with me while I share a winding tale of books, words, numbers, charts, and vision.
Insights about information design and data communication often come from unexpected places. A couple of weeks ago, I read Cristina Rivera Garza’s Liliana's Invincible Summer in its original Spanish edition, El invencible verano de Liliana, in one sitting. I was unable to put it aside even to eat. I’m not surprised that it won the Pulitzer Prize in Memoir or Autobiography last year.
(Rivera’s book title comes from a famous line in Albert Camus’s late essay ‘Return to Tipasa’. It’s no secret that I’m an avid reader of anything written by and about Camus, the French novelist, philosopher, and antiauthoritarian activist; he appears repeatedly in my most recent book, The Art of Insight. I believe that Camus’s principled moral stance, his refusal to yield to injustice and oppression, his profound fragility, and his mundane contradictions and weaknesses, are as relevant as ever.)
∗ ∗ ∗
Liliana’s Invincible Summer chronicles Rivera’s search for answers to the many questions surrounding the murder of her sister, Liliana, three decades before the book was written.
Liliana’s death was a devastating individual tragedy and, sadly, a statistically representative one. In her book, Rivera moves from the individual to the general; she writes about her sister, yes, but also to denounce a pattern: Thousands of women are killed every year in Mexico, and many, many more are the victims of gendered violence.
When Rivera mentions statistics, she does it as an implicit commentary on their limitations. Even when ethically and rigorously constructed, statistics are always a pale reflection of a multitude of individualities. Aggregation can beget cold detachment and emotional numbing.
Moreover, when it comes to femicide in Mexico—and in too many other countries—the challenge is even worse: Gendered violence is, to this day, an unnamed and undercounted catastrophe.
Rivera’s book made me take Catherine D’Ignazio’s Counting Feminicide: Data Feminism in Action from my shelves (open access draft here). Browsing through it, I was reminded of civic heroes such as María Salguero, a Mexican geophysical engineer who, back in 2016, outraged by the lack of reliable data about femicides in her country, decided to manually collect her own database and design her own maps. Salguero’s project strives not to transform people into mere numbers, but to instead preserve each victim’s individuality.
∗ ∗ ∗
Liliana’s Invincible Summer contains other thoughts relevant to data and chart design, even if they aren’t explicitly stated. For instance, before we can understand or quantify a phenomenon, we need to conceptualize it, and to give it a proper and precise name.
Femicide was typified as a crime in Mexico in June of 2012, in no small part thanks to several waves of massive protests. Before that, femicide was not only undercounted, but almost unspeakable. It was a physical reality that didn’t become a social fact until there was a term for it.
Rivera writes, “la falta de lenguaje nos maniata” (the lack of language, of words, ties our hands). “Uno nunca está más inerme que cuando no tiene lenguaje”, which means that we are unarmed, most defenseless, when we don’t have the language needed to grasp and confront reality.
New and precise language expands our vision—so does design or art, a term I’ve used repeatedly to refer to information design and data graphics. Like language, design can indeed help us see better, see more, see deeper—and also see differently, and see together. Allow me to share an example.
∗ ∗ ∗
Access to abortion figures prominently in Liliana’s Invincible Summer. Abortion is legal in parts of Mexico, but access to it is labyrinthine. This is true also in the United States, which was a balkanized country even before the overturn of Roe vs. Wade, and it’s become worse since then. This labyrinthineness is at the core of The United States Abortion Mazes, a project by The Pudding’s Jan Diehm:
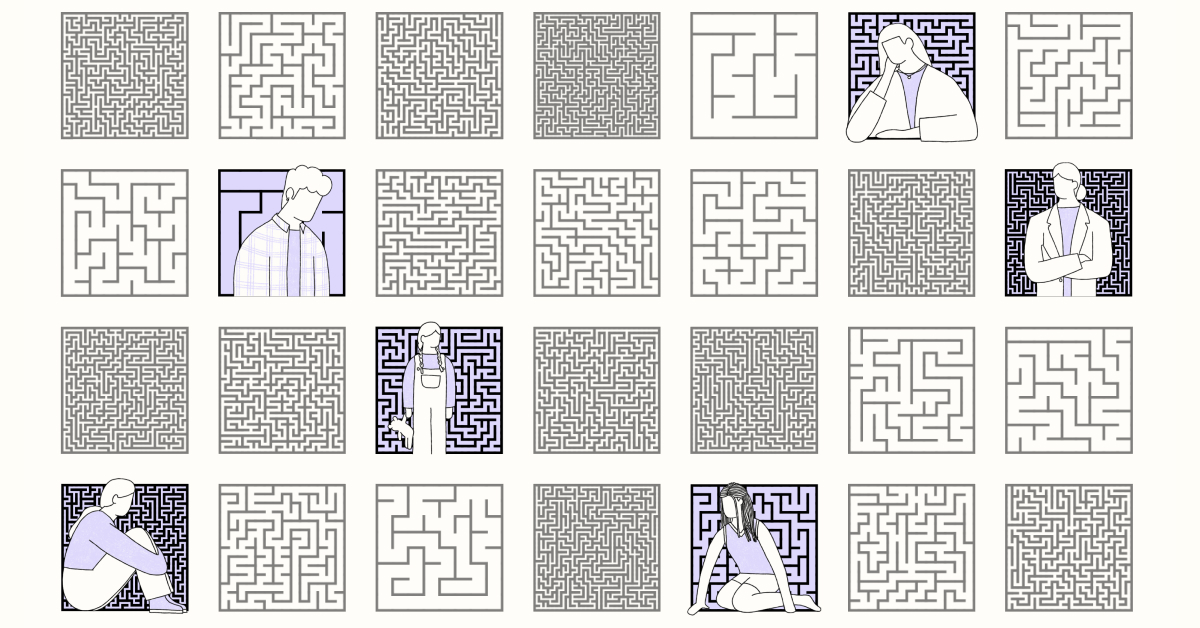
In the early draft of an upcoming book chapter, I said about Jan’s Abortion Mazes:
The Pudding’s essay demonstrates that the vocabulary of visualization is constantly expanding. […] The grammar of visualization consists of encoding information through the variation of attributes of objects, such as height, position, or color; the visual attribute in The Pudding’s abortion mazes story is an unusual one: visual density: the more difficult it is for an individual to access reproductive healthcare in a state, the more intricate that state’s maze is, and the narrower its corridors are. […]
The choice of mazes, instead of conventional charts, constitutes a unique pairing of theme and form. A bar graph is something that we can take a quick look at, feel nothing about, and move on; a maze, on the other hand, ignites the imagination and leads us to think “what does it feel like to be trapped in that, wandering and desperate to find a way out?”
Diehm’s story puts the reader at the center of the information by asking us to empathize with six characters whose experiences are representative of larger patterns. When choosing a character, we’re tasked with helping them navigate their state’s maze using the arrows on our keyboard. In some cases, the way out the maze is relatively easy to spot at a quick glance; in others, it’s close to impossible.
‘The United States Abortion Mazes’ doesn’t just visualize data, allowing us to coolly analyze it from a distance, high above the fray, the suffering, and the infuriating confusion. Instead, it prompts us to change our perspective, to witness the story first-hand, from the inside, through the eyes of someone struggling to get what they have a right to.
This is what I mean by seeing differently and seeing together.
Liliana’s Invincible Summer, D’Ignazio’s Counting Femicide, and The Pudding essay, are somber reminders that abortion is healthcare. Lack of access to it kills people. According to a recent ProPublica data-driven investigation, after Texas banned abortion with nearly no exceptions, “dozens more pregnant and postpartum women died in Texas hospitals than had in pre-pandemic years”.
These are, like Liliana’s tragedy, individual tragedies that, due to political interests, are already a pattern.
∗ ∗ ∗
One last thought that ties all the splendid work above: Knowing concepts, facts, and the words to name them, expands our critical imagination, our horizons of possibility, our vision in a similar way that being able to access and read data—and graphics that represent data—does.
That’s why any emerging autocracy hates this type of work, and therefore prohibits words, bans concepts, wipes out databases, and destroys knowledge institutions. The corrosion of the intellectual landscape is core to this political project because an impoverishment of language, textual or visual, leads to a narrowing of individual and societal vision. And vision, dear friends, is a precondition for liberty.
∗ ∗ ∗
That’s enough wandering for today. I leave you with Johnny Cash explaining why he always wore black: “I wear the black for the poor and the beaten down / Livin' in the hopeless, hungry side of town”. Wise man:
